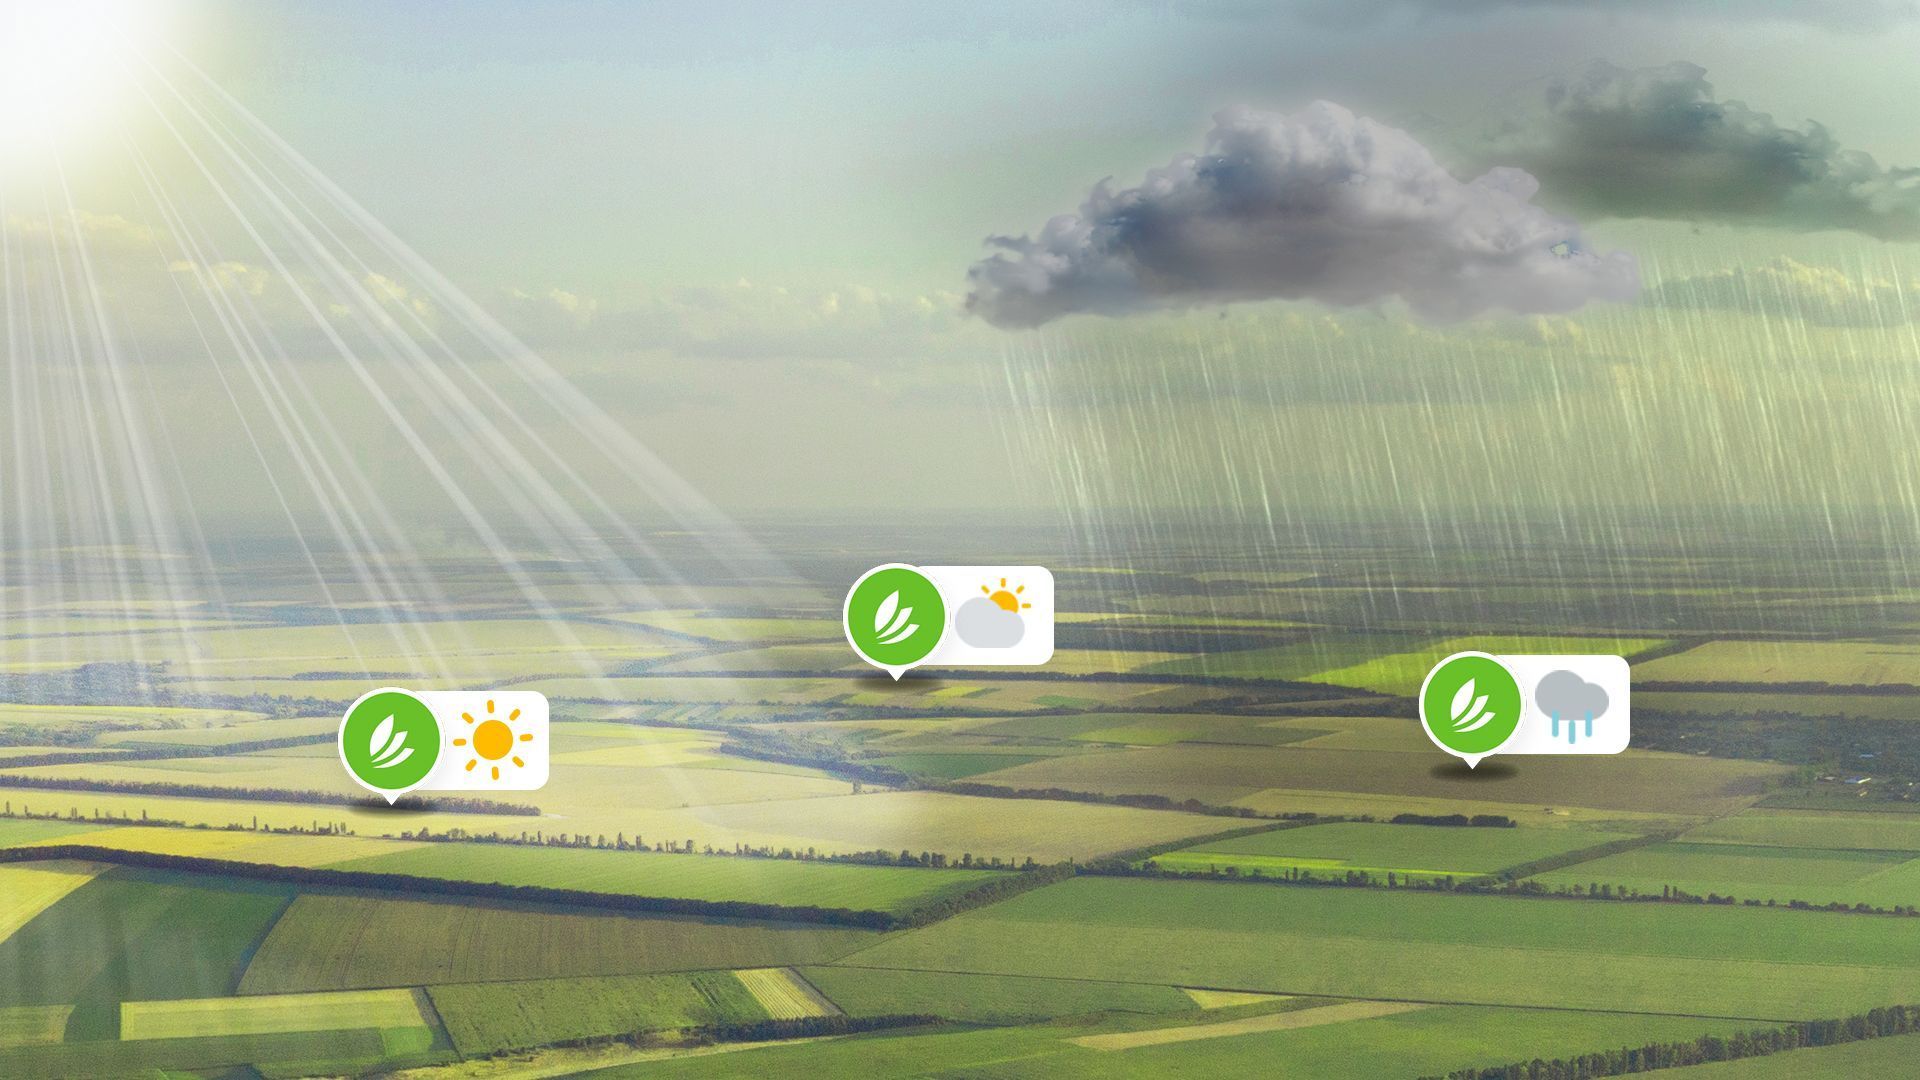
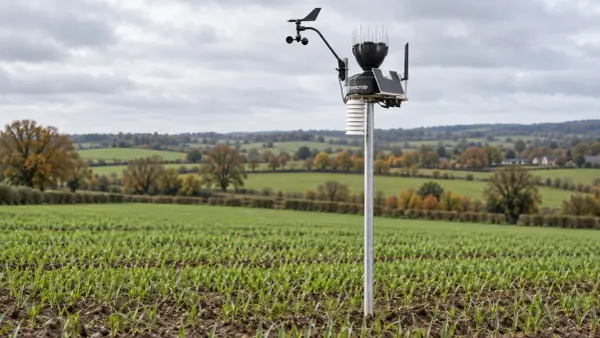
Weather forecasts are of crucial importance to farmers. They help them make informed decisions on a daily basis, plan their operations, optimise their operations and minimise risks. Today, there are several weather models available to guide them on a daily basis. But which one should you trust? Are weather forecasts really reliable, even though they differ from one model to another?
Can we rely on weather forecasts?
Technological advances over the last few decades have made it possible to achieve a level of confidence of around 90-95% for 24-hour forecasts. However, it is still not possible to provide weather forecasts that are 100% reliable. Since weather forecasts are based on real-time data, it would be necessary to know the weather conditions over the entire globe and at all altitudes with absolute precision for this to be possible.
The reliability of weather forecasts also depends on the geographical resolution of the models. In order to carry out their simulations, they divide up the territory into a grid of varying mesh sizes. The finer the grid, the greater the accuracy. Furthermore, as the forecast period extends, the margin of error increases, leading to reduced reliability.
For a deeper understanding of weather forecasting, explore our informative blog post.
So it's important to accept that forecasts can be wrong. Weather forecasting models are constantly improving to provide you with increasingly reliable data. However, the closer you get to 100% reliability, the more complicated and slow this progress becomes.
Which weather model should you trust?
There is no model that is better than another across the whole country. The reliability of a model depends not only on the location of where it is used, but also on the measurement (rain, temperature, etc), the time horizon (short or long term) and the season (winter vs. summer).
Each weather forecasting service has its own specific characteristics. These differences result from the calculation methods used for each model. For example, each model is characterised by the territory covered, the forecast period and the geographical grid.
A fundamental point to understand is that the accuracy of a forecast model depends on what is being measured. One forecasting model may be good at predicting the average temperature of a region (it is the best at this task), while another may not be good at predicting the average temperature, but may be more accurate at predicting episodes of night frost.
The best sprinter is probably not the best marathon runner. Some forecasting models are sprinters, good over short distances or short durations, while others are marathon runners, performing well over longer races. And none of them are good at high jump.
To determine the best model therefore depends on what is being measured
What forecasting models are available on the Sencrop application?
To date, 7 weather forecast models are available on the Sencrop application. A pre-selection has been made to keep only those with the highest reliability. Each model has its own specific features in terms of forecast duration, resolution and area covered.
Model name
| Forecast duration | Resolution | Territories covered | Country which created the model |
AROME | 36 hours | 2 km | France | France |
ARPEGE | 4 days | 11km | Worldwide | France (Météo-France) |
Meteoblue | 7 days | Aggregation of several models | Worldwide | Switzerland |
GFS (used in particular by Météociel and Meteo60) | 7 days | 22km | Worldwide | United States |
ICON | 5 days | 7km | Europe | Germany |
HARMONIE | 2 days | 5km | Europe | Netherlands (KNMI : Dutch weather agency) |
UKMO | 6 days | 17km | Worldwide | UK (Metoffice) |
How can you be sure that you're using the most reliable forecasts for your plot of land?
By talking to farmers, it is possible to identify two ways of using weather forecasts:
- Juggling between various forecast models or weather websites to compare predictions and form their own conclusions
- always relying on the same forecast model
In both cases, how can you be sure that you're relying on the right forecasts?
It's impossible to obtain 100% reliable forecasts, but you can be sure of getting the most reliable forecasts for your plot thanks to Sencrop's new products.
Test the new Sencrop features !
Create your profile and take advantage of a free, no-obligation trial to discover the new Sencrop weather experience.