Sencrop launches the ultra-local weather forecast revolution
• 3 min read
Knowing which model to rely on for accurate weather forecasts can be a real headache. To make this choice easier and more efficient, Sencrop is providing you with a range of functions that allows you to benefit from the most reliable forecasts for your plots, and organise your planning and operations with peace of mind.
Farm weather forecasts: how do they work?
Weather forecasts are based on models (or algorithms) that take into account multiple parameters (atmospheric pressure, wind speed, temperature, etc.) to simulate weather conditions and project them into the near future.
There are different forecast models, the reliability of which depends on the phenomenon measured (temperature, rainfall, hygrometry and wind speed) as well as your location. Sencrop brings these models together in a single application and helps you define the most reliable forecasts for your plots! Discover the three new Sencrop features that will accompany you on a daily basis:
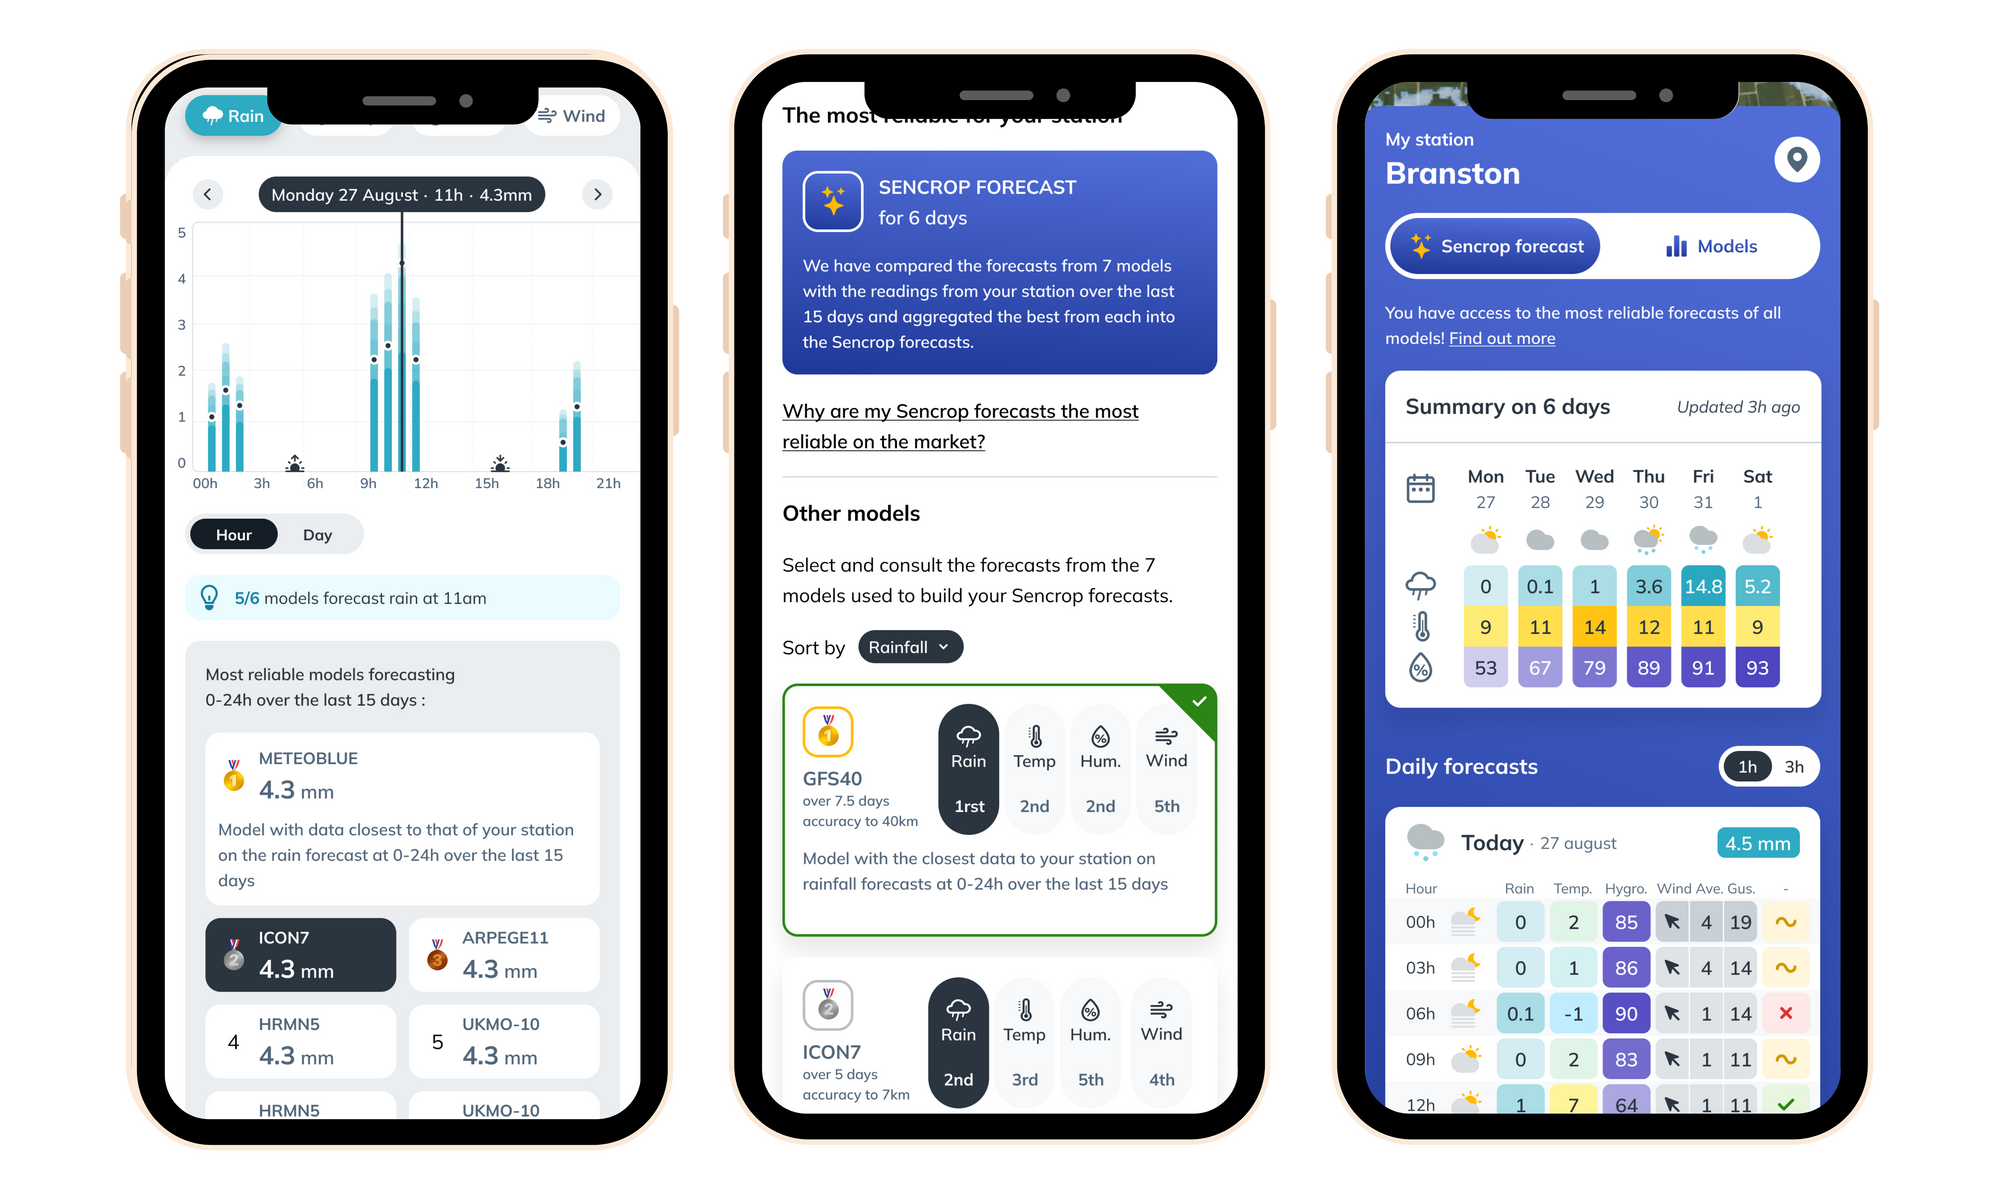
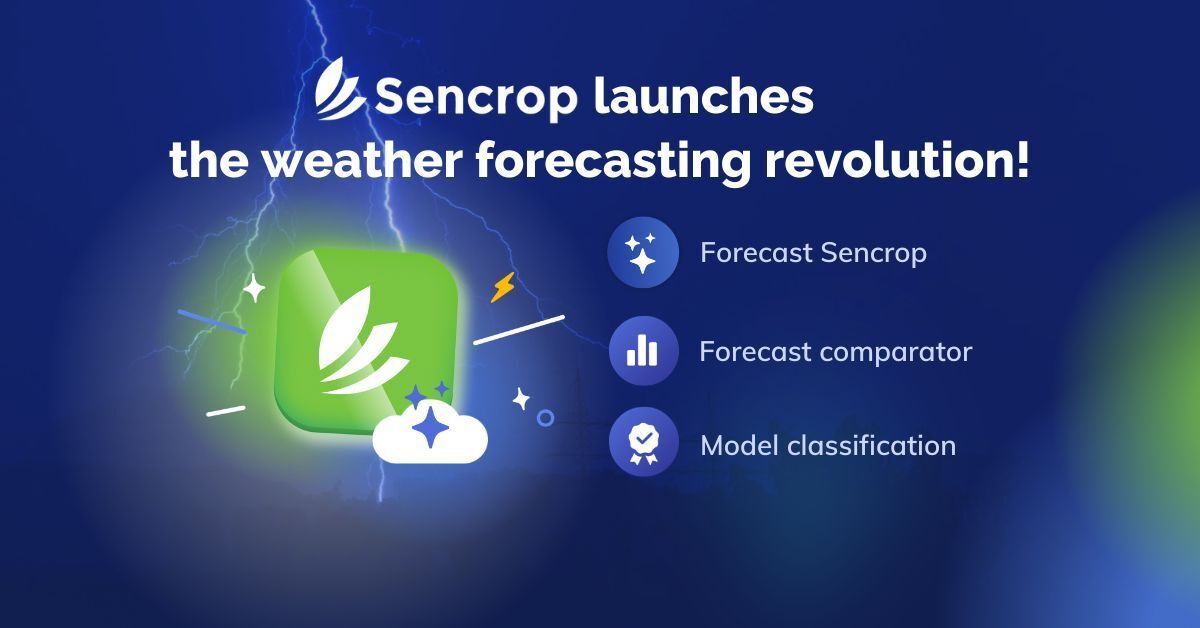
Tailor-made Sencrop forecasts: Sencrop compares the data collected by your station with all models, to automatically aggregate the most reliable forecasts for your location, with visibility up to D+7. Sencrop Forecasts continually evolve and improve as your station records data, always providing you with the best forecasts. Gain reliability and access the best forecasts for your plot!
Forecast comparator: A single graph allows you to compare all forecast models, by type of meteorological measurement (rainfall, temperature, hygrometry, wind speed). This allows you to simplify reading and comparison of forecasts.
Classification of models: Sencrop classifies all weather forecast models in order of reliability, for each type of measurement (rainfall, temperature, wind, hygrometry). This evaluation is made based on the data collected by your station and is therefore specific to each user.
Screens showing the new Sencrop fezatures : Forecast comparator - Model ranking - Sencrop forecast (from left to right)
Here are 3 questions asked to Rémy, product manager at Sencrop, to give you a more detailed insight into our new features.
Hello Rémy, what was your approach to developing these features?
We are in regular contact with farmers to best understand their daily challenges and weather-related needs. This serves as the foundation for our ongoing enhancement initiatives for the Sencrop application. We engaged in extensive discussions regarding the reliability of weather forecasts and the challenges farmers face in determining which forecasts to place their trust in. We therefore looked for a solution to best overcome this problem and improve the daily lives of our users.
What changes do these new features bring to the way we consume weather forecasts?
With these new features, two possibilities are available to you.
If you want to save time and find the most reliable forecasts for your plot in one click, you can use Sencrop Forecasts. This feature is there to simplify the consumption of forecasts.
However, if for example you have specific projects to plan, depending on particular weather parameters, you will be able to deepen your analysis of weather forecasts thanks to our forecast comparator and our classification of models. For example, in the event of a risk of frost, you can immediately identify the lowest temperatures envisaged by the different forecast models and thus minimise the danger for your crops.”
How are you able to identify the most reliable forecasts for each Sencrop user?
To identify the most reliable forecasts for each Sencrop user, we rely primarily on the weather stations on your plots. They allow us to compare model predictions with actual data observed in the field. By analysing how predictions correspond to observations, we can determine the most accurate and reliable model data for each user.
It is important to mention that our extensive network of 35,000 connected weather stations also plays a vital role. This network allows us to support and refine forecasts on a larger scale, taking into account geographic disparities.
Test the new Sencrop features !
Create your profile and take advantage of a free, no-obligation trial to discover the new Sencrop weather experience.
Twice a month, news on agricultural weather, ag-tech, and Sencrop innovations to enlighten you and help you make better decisions every day. Subscribe now! 👇