The disease triangle: how to better anticipate risks in agriculture?
• 3 min read
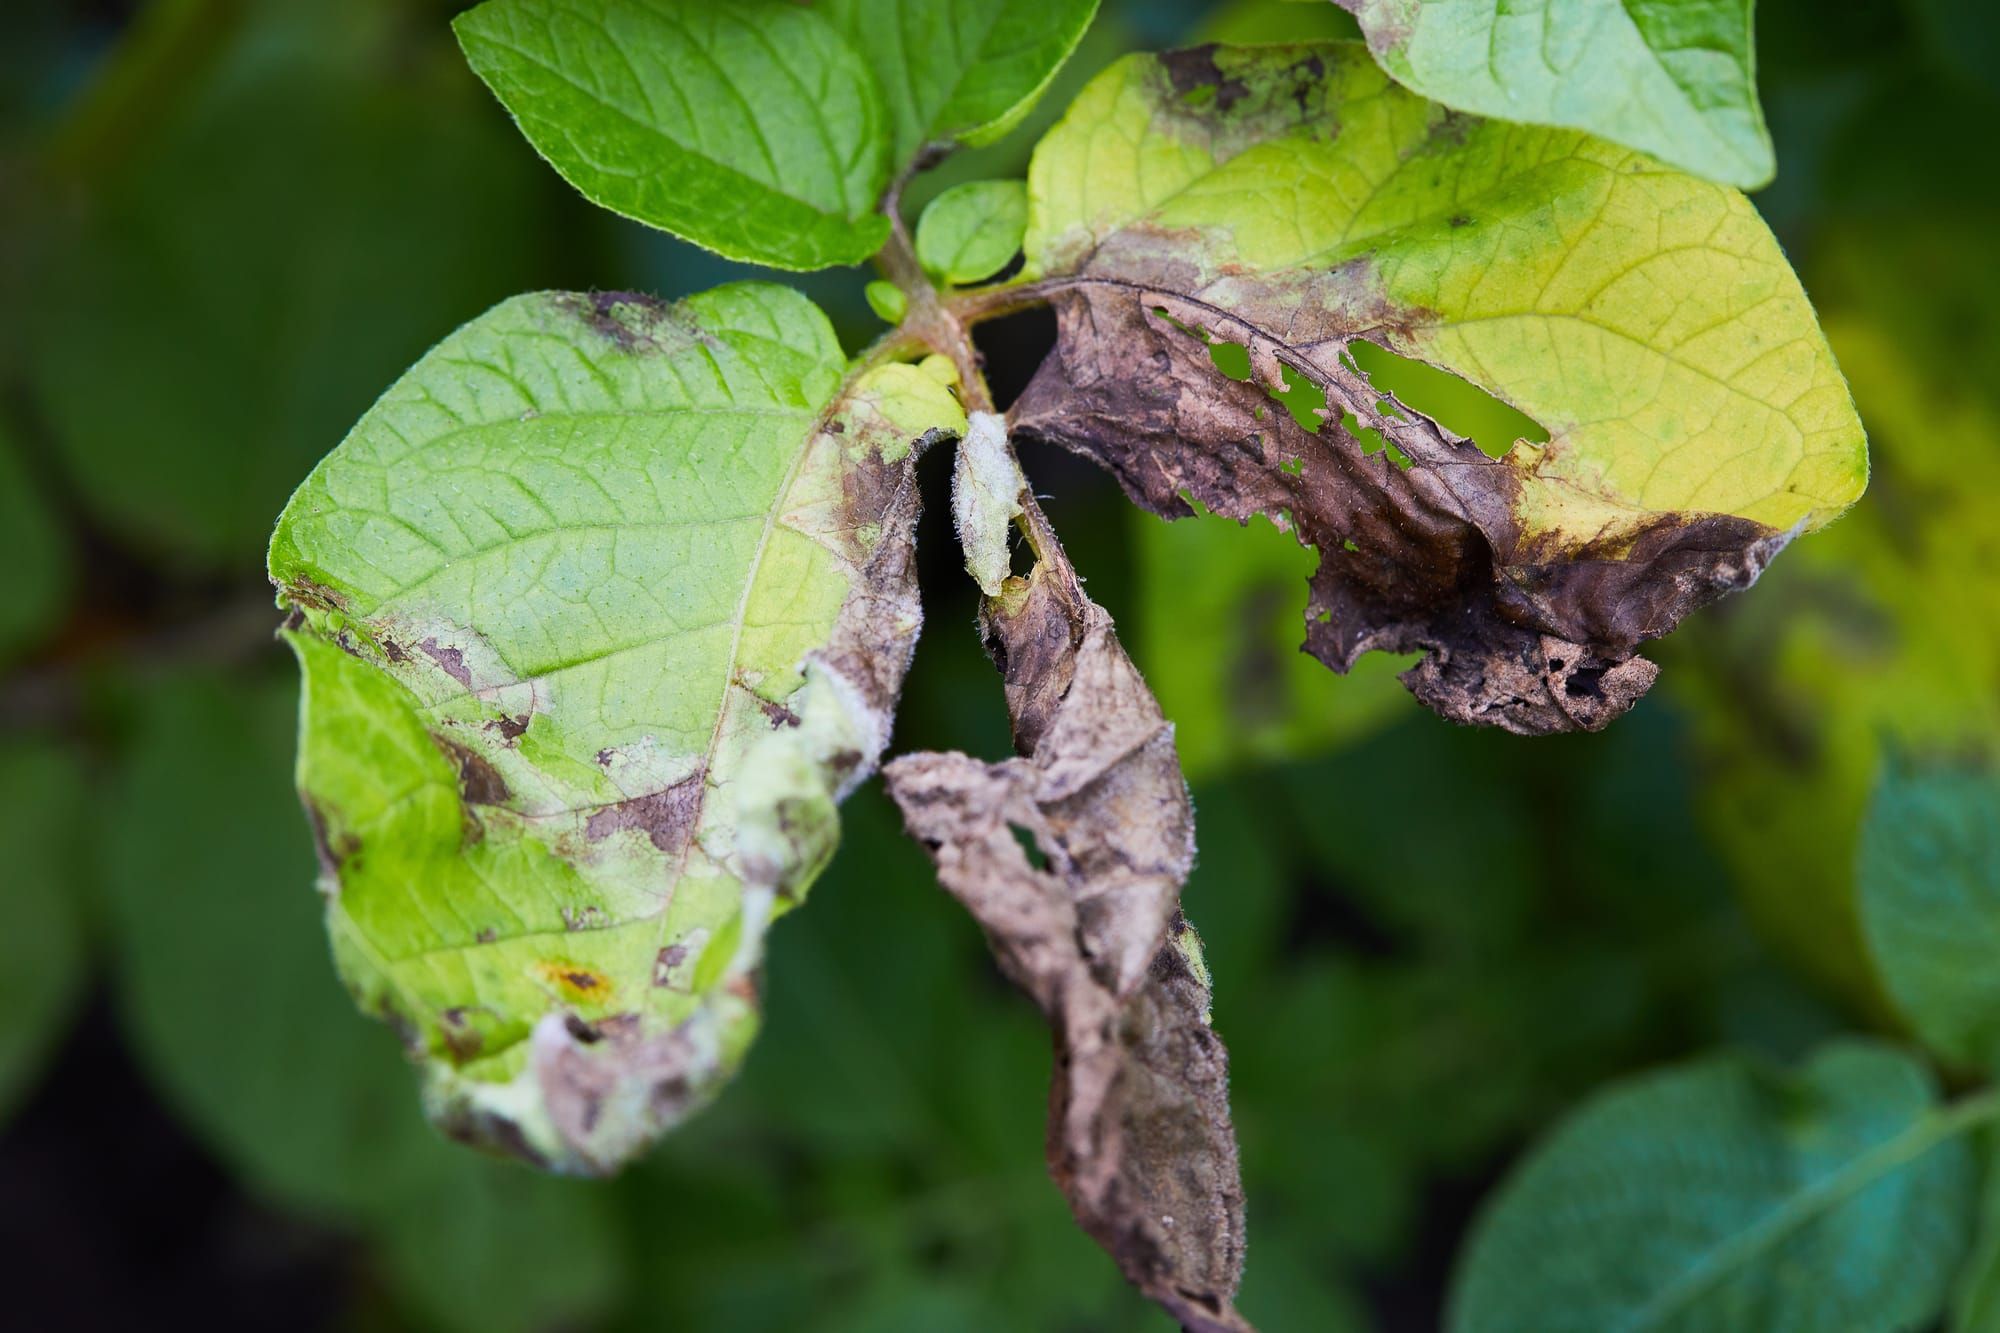
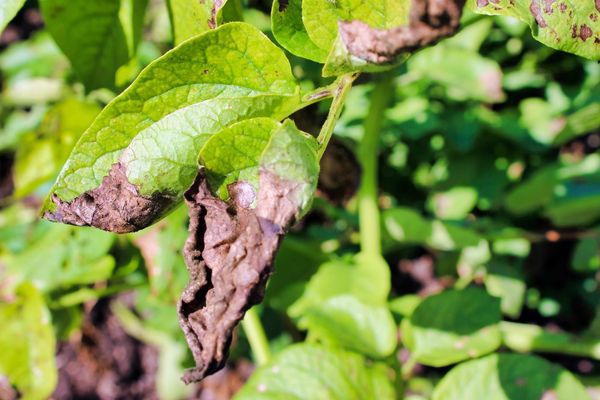
Crop diseases sometimes seem to appear out of nowhere. One week, the field looks healthy; the next, the first symptoms appear and the situation can deteriorate rapidly. Yet, these episodes are never random.
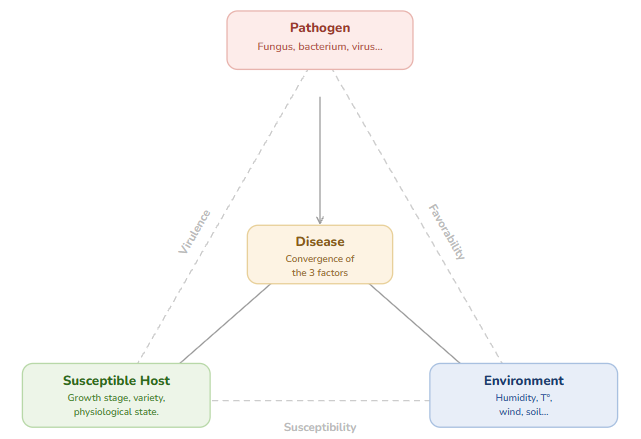
For a disease to develop, three conditions must be met simultaneously:
the presence of a pathogen
a sufficiently susceptible plant
environmental conditions favorable to the development of the disease
This is what agronomists call the disease triangle.
The three vertices of the triangle
The pathogen
The pathogen is the organism that causes the disease. It can be a fungus (downy mildew, powdery mildew, septoria leaf blotch, fusarium wilt), bacteria, virus, etc. In the vast majority of cases, these agents are already present in the field environment: in the soil, on crop residues, in the ambient air, or via insect vectors.
The host plant
Not all plants react in the same way to the same pathogen. The level of risk depends on several parameters specific to the crop, such as the variety (some are naturally resistant, others particularly vulnerable to specific diseases), the phenological stage (such as flowering or stem elongation), the general physiological state (water stress, mineral deficiency, etc.) and the cultivation history (rotations, sowing density, etc.); all factors that modulate the risk at the field level.
💡
In practice, the pathogen and the plant are often parameters that the farmer can estimate with relative accuracy: they know the variety, its history, and can find out about local pest pressure. The third factor, however, is beyond any direct control but can be measured and anticipated.
The Environment
This is where everything happens. The environment, and in particular weather conditions, is recognized as the most decisive factor in triggering plant diseases, but also the most difficult to predict.
For example, septoria leaf blotch of wheat requires a sufficient period of leaf wetness, whereas downy mildew of grapevines spreads during warm, humid periods. Powdery mildew, on the other hand, prefers a warm, dry atmosphere.
The meteorological parameters to monitor include:
temperature (minimum, maximum, temperature range)
relative humidity
duration of leaf wetness (often the most discriminating parameter)
precipitation and its intensity
and wind, which influences spore dispersal
Why is weather a strategic lever?
A simple rain event followed by a mild, humid night can be enough to trigger an outbreak that would never have occurred under dry conditions. Conversely, a windy, dry period during a susceptible stage can pass without incident, even if the pathogen is abundant.
The importance of local weather data...
For these models to function correctly, the quality of the input data is crucial.
Weather data from a station several kilometers away may not accurately reflect the actual conditions of the field, especially regarding leaf wetness duration, which can vary significantly from one field to another depending on exposure, topography, or vegetation density.
💡
This is where ultra-local weather data comes in. Having precise measurements, directly at the plot level or in the immediate vicinity, allows us to: 1) detect conditions favorable to infection that regional weather forecasts would not have revealed; 2) refine alerts by reducing false positives (unnecessary treatment) and false negatives (undetected contamination), and achieve treatment savings; 3) and build a plot-level climate history, useful for understanding past events and better calibrating models.
In practice, a difference of a few degrees or a few hours of rainfall can mean the difference between no risk and a high risk.
...and precise!
Data accuracy is essential for sound decision-making.
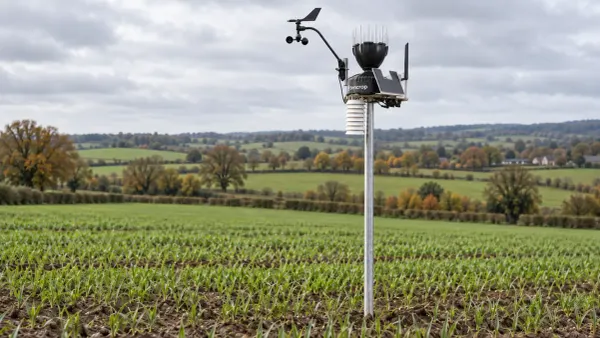
For data to be reliable, the sensor must also be reliable. Sencrop stations are designed with a dedicated sensor for each type of measurement (temperature, rainfall, wind speed and direction, dew point, leaf wetness) to prevent interference and guarantee the accuracy of each indicator.
Each component undergoes rigorous selection of raw materials and extensive quality testing:
sensor calibration
rain gauge design (shape and material of the collection container)
reliability of the onboard electronics.
Anomaly detection algorithms complement this system to automatically identify any drift or aberrant data before it influences a decision.
Finally, a responsive support team assists users with any questions or incidents, ensuring that the decision-making chain (from sensor to agronomic alert) is never interrupted.
To learn more about monitoring weather conditions favorable to disease and using station data to support agronomic decision-making, explore Sencrop's solutions.
The Sencrop team
Share this article
A newsletter on weather and Ag-Tech
Twice a month, news on agricultural weather, ag-tech, and Sencrop innovations to enlighten you and help you make better decisions every day. Subscribe now! 👇